Immersion Canary®
 Immersion Canary®
Continuous fluid health monitoring for immersion cooling.
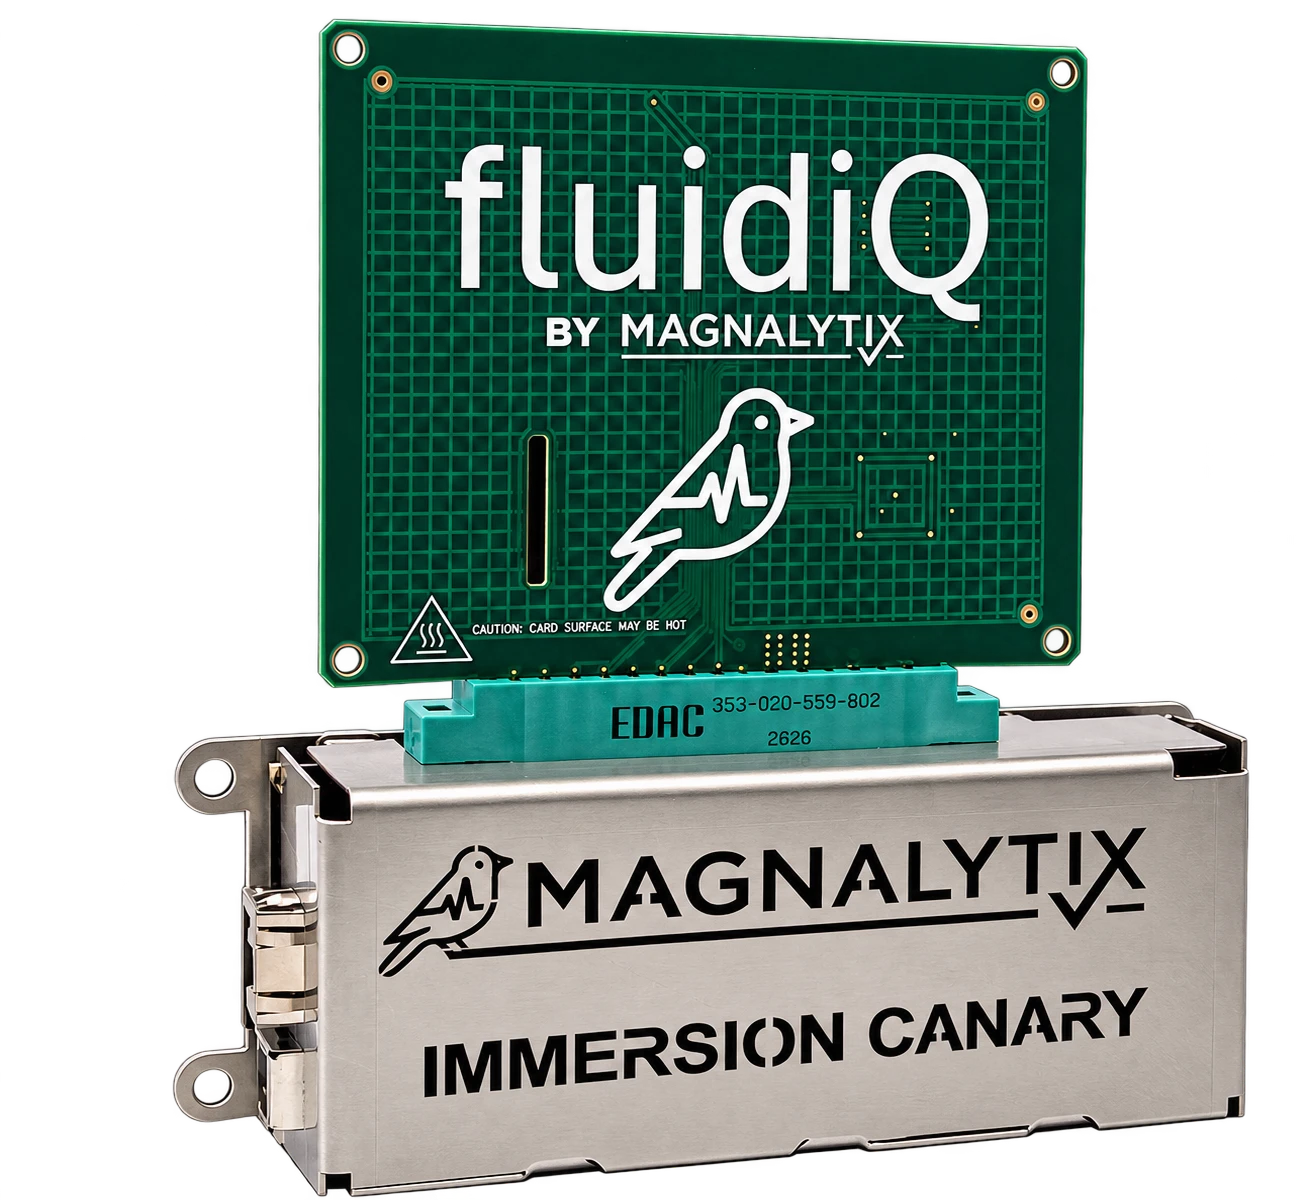
Immersion Canary monitors representative test structures and fluid volume resistivity inside single-phase and two-phase immersion tanks. Retrieve live measurements through the API at up to one sample per second to track changing electrical conditions.
Hardware & software
See Immersion Canary in action.
Explore the instrument and its software with simulated data. Get a feel for the hardware, the interface, and the changing signals.
Fluid condition, measured where it matters
Fluid analysis tells you how the fluid is changing: acid number, moisture, particulates, metals, color. Immersion Canary adds continuous electrical measurements on representative test structures in the same fluid, helping you assess changes in the tank's electrical environment.
The two work together. Electrical trends can help guide sampling and investigation. Laboratory analysis helps identify what changed and why. Immersion Canary complements that analysis rather than replacing it.
- The fluid changes as it ages, absorbs contamination or interacts with materials
- That changes the electrical environment inside the tank
- Immersion Canary measures that environment continuously
- Deviation from the tank's healthy baseline is reported as it happens
- Use the change to guide investigation and maintenance
How it works
- Observe
In the fluid, beside your hardware
The EID sensing card monitors Environmentally Induced Degradation (EID) alongside your hardware in the same dielectric fluid, with controlled electrical bias and heating on representative test structures.
- Measure
Surface resistance and volume resistivity
Immersion Canary measures surface resistance from 1 MΩ to 1 TΩ and fluid volume resistivity from about 1.5 MΩ·cm to 1.5 TΩ·cm (about 15 kΩ·m to 15 GΩ·m). Both measurements are standard and reveal changes in the electrical environment over time.
- Trend
Against its own baseline
Retrieve measurements through the API at up to one sample per second and compare them with the tank's baseline. Use your monitoring platform or Aviary to record and retain measurements for later analysis.
- Act
Investigate changing conditions early
Configurable pass and warning thresholds highlight changes in the dashboard and through the API. Use the electrical trends to guide investigation and laboratory analysis of the fluid.
Explore the hardware
Rotate the models and switch between the sensing card, assembled Immersion Canary, and Immersion Canary with the optional 1U rack perch.
Scroll on to load the interactive 3D hardware explorer.
Meet the Immersion Canary Test Card
The removable sensing card brings representative electronic structures into the same fluid as your equipment. Its card-edge connector lets you replace the sensing element while keeping the instrument enclosure.
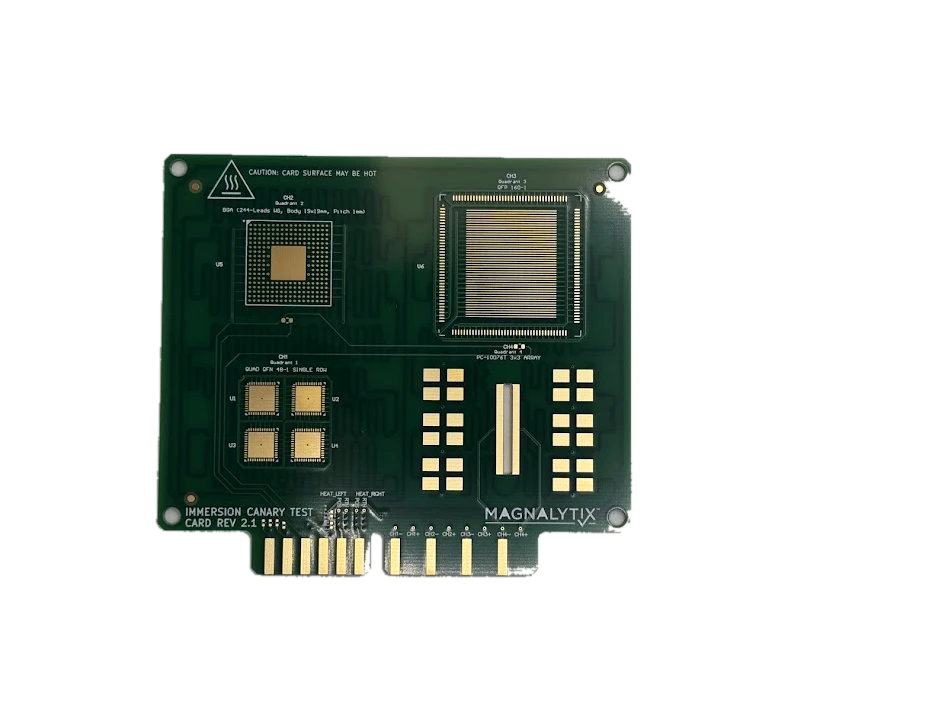
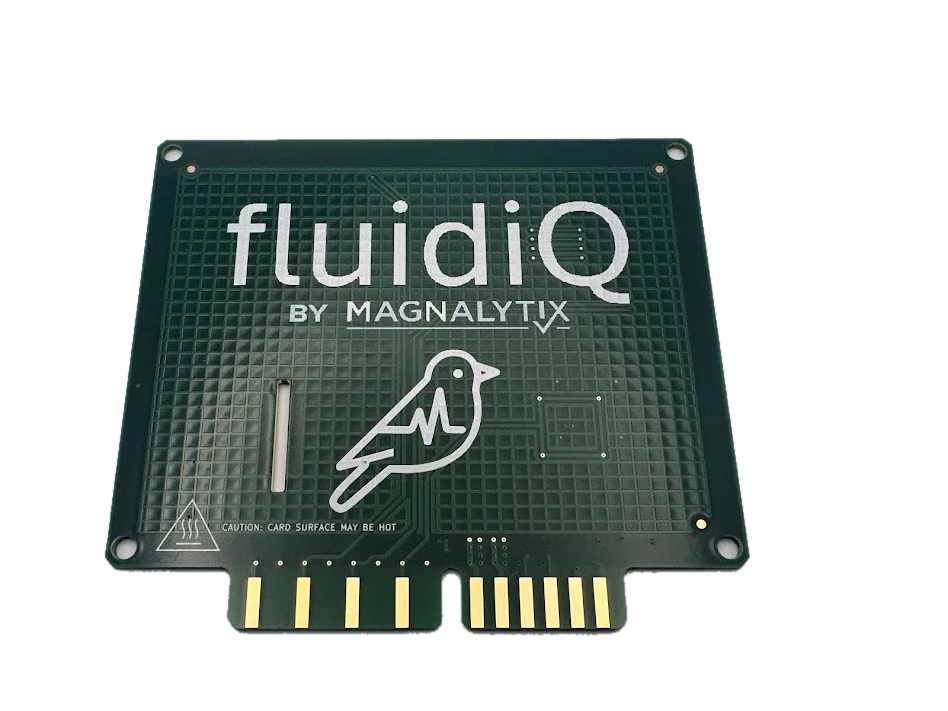
- Representative test structures. BGA, QFP, and QFN geometries reveal changes in surface resistance across different package shapes and clearances.
- Fluid volume resistivity. An electrode measures the bulk fluid alongside the surface measurements.
- Temperature context and control. Paired thermistors report card temperature, while integrated heating provides a controlled test condition.
Install and integrate
Plan sensing-card placement, network access, and the Immersion Canary services that connect measurements to your monitoring system.
In the tank
Sensing card in the fluid
The sensing card sits in the same dielectric fluid as your equipment, measuring surface resistance and fluid volume resistivity. Plan card placement and mounting for your tank configuration.
On your network
Power and data over Ethernet
Connect Immersion Canary to standards-based Power over Ethernet. One Ethernet cable supplies power and connects the instrument to your network, where its built-in dashboard provides live readings.
In your monitoring software
Connect your monitoring stack
Use HTTP/JSON for custom tools, Redfish for fleet monitoring, Modbus/TCP for PLC and SCADA systems, or MQTT to publish to your broker. Enable and configure the services your deployment needs on each Immersion Canary.
Integration services
Enable only the interfaces each deployment needs. Every service is configured on the Immersion Canary, with conservative defaults for discovery and control, and connects directly on a controlled LAN with no external service in the path.
- HTTP { JSON }
Operators + custom tools
HTTP + JSON API
The embedded dashboard and documented REST/JSON API ship on the instrument. Read live measurements and health locally, then use authenticated Admin requests when an integration needs configuration or control.
- Local access without internet or a cloud account
- Browser session or HTTP Basic authentication
Fleet monitoring + DCIM
Redfish®
A Redfish API exposes identity, sensor collections, thermal resources and approved actions to the management platforms that watch Immersion Canary fleets.
- Standard service root and schema discovery
- Optional SSDP/UPnP network discovery

PLC + SCADA
Modbus/TCP
Read a PLC-friendly telemetry block alongside the tank-level, pump and alarm controls already in the cabinet. Monitoring is read-only by default. Bounded control writes can be enabled for an approved design.
- Canonical snapshot on TCP port 502
- FC01/03/04 reads and optional FC05/06/16 writes

Historians + brokers
MQTT
Publish outbound status and complete telemetry snapshots to the broker you choose. Configure the broker, port, client ID, credentials, topic prefix and reporting interval on each Immersion Canary.
- Retained online status and offline last will
- Outbound telemetry only, no control topic
The interface ships with the instrument
Open the built-in dashboard in a browser on your local network. No internet connection, cloud account, or software installation is required to begin. Measurements stay accessible locally; use your monitoring platform or Aviary to record a history.
Watch live readings update and the display switch from logarithmic values to SI units. The recording shows a point on the trend, with surface resistance and fluid volume resistivity displayed separately.
This is the interface shipped on the actual Immersion Canary device, shown here with simulated data. Time is accelerated. These illustrative scenarios are not test results. Device configuration is read-only.
Record and compare with Aviary
Optional desktop software for recording sessions across multiple Immersion Canary devices, comparing trends, and exporting data for analysis. Built for laboratory work, fluid development, and teams without an existing monitoring platform.
One workspace for the flock, with the selected Immersion Canary’s measurements alongside.
What it monitors
Fluid health, continuously
Surface resistance from 1 MΩ to 1 TΩ across PCB-representative test structures in your dielectric, under a bias you configure, alongside fluid volume resistivity from about 1.5 MΩ·cm to 1.5 TΩ·cm (about 15 kΩ·m to 15 GΩ·m).
Measured against your own baseline
Each tank sets its own baseline when it is commissioned and healthy. Live condition is reported against that baseline, so what you see is change in your environment rather than a generic threshold.
In real operating conditions
Independent heater control simulates the localized heating of high-power components on the test card. Heater duty cycle and test-card temperature are reported alongside the electrical measurement.
Into the systems you already run
A dashboard served by the instrument itself, plus HTTP/JSON REST, Redfish, Modbus/TCP and MQTT for your historian, DCIM, SCADA or alerting stack.
Specifications
Download data sheet (PDF, opens in a new tab)Measurement
| Parameter | Value |
|---|---|
| Surface resistance range | 1 MΩ to 1 TΩ |
| Volume resistivity | ≈1.5 MΩ·cm to 1.5 TΩ·cm (≈15 kΩ·m to 15 GΩ·m), nominal cell geometry |
| EID bias voltage | 0 to 19 VDC |
| EID sensing card | 1 per unit |
| Heater voltage | 2.33 to 8.43 V |
| Heater duty cycle | 0 to 100% |
| Maximum API polling rate | Up to 1 Hz |
| Thresholds | Configurable pass / warning |
| Leakage current channels | 4 independent test-card channels |
| Temperature channels | 2 independent test-card channels |
| Embedded test-card heater power | Up to 55 W with IEEE 802.3bt PoE; lower with 802.3af/at |
Mechanical and environment
| Parameter | Value |
|---|---|
| Enclosure dimensions (L × W × H) | 6.29 × 1.36 × 2.88 in; height with test card: 6.25 in |
| Weight with test card | 261 g (9.2 oz) |
| Operating fluid temperature | 40 to 85 °C |
| Immersion cooling modes | Single-phase and two-phase |
Power and connectivity
| Parameter | Value |
|---|---|
| Power source | PoE, IEEE 802.3af / at / bt |
| Passive PoE | Not supported |
| Network | 10/100 Ethernet, RJ-45 |
| IP assignment | DHCP or static |
Interface and data
| Parameter | Value |
|---|---|
| User interface | Built-in web interface |
| API | HTTP, REST, JSON |
| Management protocol | DMTF Redfish® API with optional SSDP/UPnP discovery |
| Industrial protocol | Modbus TCP |
| Broker protocol | MQTT status and telemetry publishing |
| Data recording | Record via API in your monitoring platform or Aviary |
| USB serial | Configuration and continuous telemetry without a network |
Quality and compliance
| Parameter | Value |
|---|---|
| Quality management system | ISO 9001:2015 |
| Country of origin | United States, Nashville TN |
Research and technical material
- Ongoing researchInternal experimental study
Fluid Oxidation Study
An ongoing study using Immersion Canary instrumentation to track the electrical behavior of aged and oxidized immersion fluids against controls.
Data collection is ongoing. No conclusions are stated from this work yet.
- PublishedIndustry collaboration
OCP Material Compatibility Workstream
Through its participation in the OCP Material Compatibility Workstream, fluidiQ by Magnalytix helped build and continues to help maintain the open-source Material Compatibility Database, covering wetted material compatibility across single-phase and two-phase dielectric fluid families.
Technical material
- Technical Data Sheet· PDF
Immersion Canary Technical Data Sheet
Measurement range, installation requirements and integration options for Immersion Canary.
- Research
OCP Material Compatibility Dashboard
Search, filter, compare and export 570 wetted material compatibility records across six dielectric fluid families in the open-source OCP community database.
Talk to us about your environment.
Tell us what you are running, the fluid, how many tanks, and whether you are in production or still evaluating, and we will come back with a quote and a recommendation for your environment.